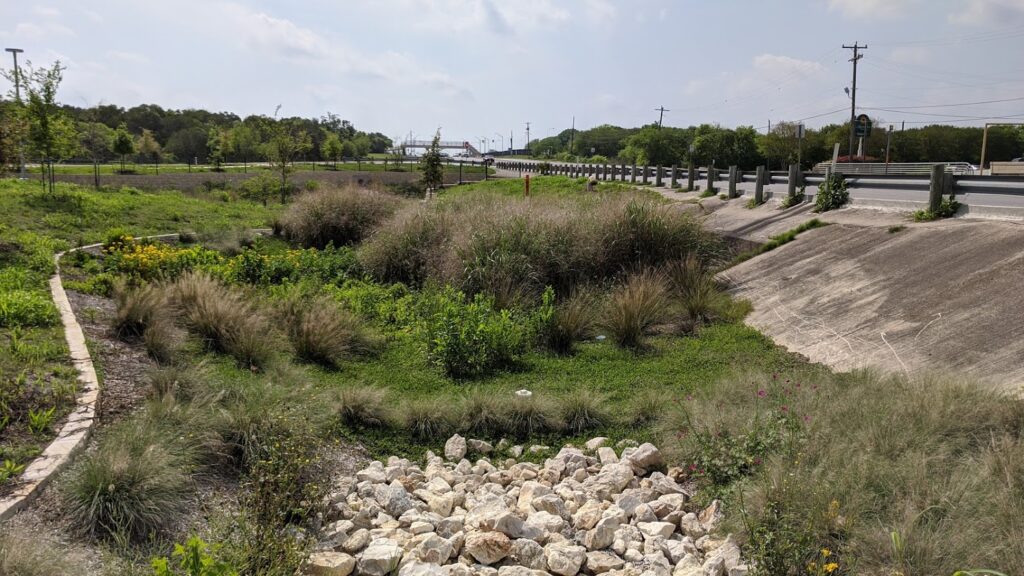
As part of our commitment to safe, clean, enjoyable creeks and rivers, the San Antonio River Authority (River Authority) actively promotes the use of green infrastructure, a group of design practices which function like green space and natural areas to slow, detain, and filter stormwater. The design and installation of green infrastructure helps reduce local flooding and improves water quality.
The River Authority has built a Green Infrastructure Impact Overview dashboard to support the community in understanding the benefits of using green infrastructure to address stormwater runoff. Read along as we share more information about the dashboard features and why it’s important to treat stormwater runoff to protect our creeks and rivers!
Why is it important to treat stormwater runoff?
In the San Antonio River Basin, as more natural surfaces are paved and developed, less rainwater percolates into the ground and instead goes over impervious surfaces and into storm drains, picking up pollutants and carrying them directly to creeks and rivers. The untreated rainwater that goes into storm drains and directly to our creeks and rivers is known as stormwater runoff. Pollutants like oil, grease, metals, bacteria, sediment, fertilizers, pesticides, pet waste, and thermal pollution accumulate on surfaces. During rain events, these pollutants are emptied directly into creeks and rivers as stormwater runoff is carried through traditional stormwater infrastructure. Runoff during hard downpours can contribute to street and neighborhood flooding as well. Over time, surges of stormwater runoff from urbanized areas can erode creek banks and negatively affect bridge and other community infrastructure.
Measuring the Impact of Stormwater Management
The relationship of stormwater management to sustainable development methods is sometimes not so obvious. The mission of this dashboard is to introduce the green infrastructure (GI) method of stormwater management and to quantify the results of known, verified GI features installed within the San Antonio River Basin. Using data from our Watershed Wise Rebate Program, school grant portfolio of green infrastructure projects along with information extracted from green infrastructure retrofit projects at our facilities, a calculation of the benefits provides a clearer idea of the advantages of five green infrastructure methods.
The interactive dashboard indicates data for the following methods commonly referred to as best management practices (BMP): bioretentions, cisterns, permeable pavement, bioswales, and green roofs. By clicking on a BMP, the dashboard will automatically calculate the cumulative result of the specific BMP from all known, verified project sites. The Impact Overview dashboard measures stormwater volume controlled, total suspended solids removed, total nitrogen removed, E. Coli removed, and impervious area treated. For visualization, the dashboard provides relatable examples to help define the magnitude of these measurements such as Olympic pools and football fields.
We invite you to explore this new dynamic dashboard and hope this inspires more people to employ green infrastructure strategies that will not only improve stormwater management, but will also provide numerous other environmental, social, and economic benefits – all resulting in healthier creeks and rivers!


